Splitting Strategies Gallery#
285 words | 1 min read
Choosing the right cross-validation object is a crucial part of benchmarking a model properly. There are many ways to split data into training, validation, and test sets in order to avoid model overfitting, to standardize the number of groups in test sets, etc.
This example visualizes the behavior of several common splitting strategies for comparison.
See also
The original sklearn notebook this page is based on.
Show code cell source
import numpy as np
import matplotlib.pyplot as plt
from matplotlib.patches import Patch

from molflux.splits import load_splitting_strategy

rng = np.random.RandomState(1338)
cmap_data = plt.cm.Paired
cmap_cv = plt.cm.coolwarm
n_splits = 4
figsize = (8, 4)
Visualise our data#
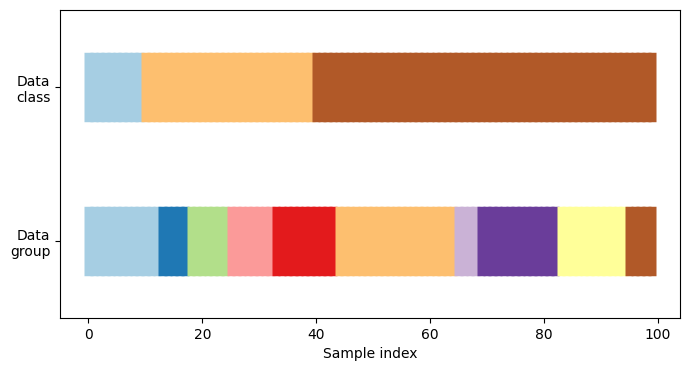
First, we must understand the structure of our data. It has 100 randomly generated input datapoints, 3 classes split unevenly across datapoints, and 10 “groups” split evenly across datapoints.
As we’ll see, some cross-validation objects do specific things with labeled data, others behave differently with grouped data, and others do not use this information.
To begin, we’ll visualize our data:
Show code cell source
# Generate the class/group data
n_points = 100
X = rng.randn(100, 10)

percentiles_classes = [0.1, 0.3, 0.6]
y = np.hstack([[ii] * int(100 * perc) for ii, perc in enumerate(percentiles_classes)])

# Generate uneven groups
group_prior = rng.dirichlet([2] * 10)
groups = np.repeat(np.arange(10), rng.multinomial(100, group_prior))


def visualize_groups(classes, groups, name):
    # Visualize dataset groups
    fig, ax = plt.subplots(figsize=figsize)
    ax.scatter(
        range(len(groups)),
        [0.5] * len(groups),
        c=groups,
        marker="_",
        lw=50,
        cmap=cmap_data,
    )
    ax.scatter(
        range(len(groups)),
        [3.5] * len(groups),
        c=classes,
        marker="_",
        lw=50,
        cmap=cmap_data,
    )
    ax.set(
        ylim=[-1, 5],
        yticks=[0.5, 3.5],
        yticklabels=["Data\ngroup", "Data\nclass"],
        xlabel="Sample index",
    )


visualize_groups(y, groups, "no groups")
Define a function to visualize splitting behavior#
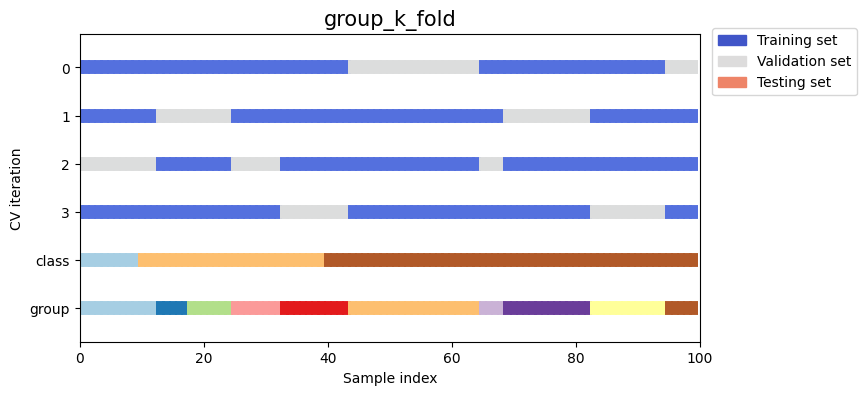
We’ll define a function that lets us visualize the behavior of each splitting strategy. We’ll perform 4 splits of the data. On each split, we’ll visualize the indices chosen for the training set (in blue), the validation set (in grey), and the test set (in red).
Show code cell source
def plot_cv_indices(cv, X, y, group, ax, n_splits, lw=10):
    """Create a sample plot for indices of a cross-validation object."""

    # Generate the training/testing visualizations for each CV split
    for ii, (tr, tv, tt) in enumerate(cv.split(dataset=X, y=y, groups=group, n_splits=n_splits)):
        # Fill in indices with the training/test groups
        indices = np.array([np.nan] * len(X))
        indices[tr] = 0
        indices[tv] = 1
        indices[tt] = 2

        # Visualize the results
        ax.scatter(
            range(len(indices)),
            [ii + 0.5] * len(indices),
            c=indices,
            marker="_",
            lw=lw,
            cmap=cmap_cv,
            vmin=-0.2,
            vmax=2.2,
        )

    # Plot the data classes and groups at the end
    ax.scatter(
        range(len(X)), [ii + 1.5] * len(X), c=y, marker="_", lw=lw, cmap=cmap_data
    )

    ax.scatter(
        range(len(X)), [ii + 2.5] * len(X), c=group, marker="_", lw=lw, cmap=cmap_data
    )

    # Formatting
    yticklabels = list(range(n_splits)) + ["class", "group"]
    ax.set(
        yticks=np.arange(n_splits + 2) + 0.5,
        yticklabels=yticklabels,
        xlabel="Sample index",
        ylabel="CV iteration",
        ylim=[n_splits + 2.2, -0.2],
        xlim=[0, 100],
    )
    ax.set_title("{}".format(cv.tag), fontsize=15)

    ax.legend(
        [Patch(color=cmap_cv(0.02)), Patch(color=cmap_cv(0.5)), Patch(color=cmap_cv(0.8))],
        ["Training set", "Validation set", "Testing set"],
        loc=(1.02, 0.8),
    )

    return ax
Let’s see how it looks for the k_fold cross-validation object:
Show code cell source
fig, ax = plt.subplots(figsize=figsize)
strategy = load_splitting_strategy("k_fold")
plot_cv_indices(strategy, X, y, groups, ax, n_splits)
/home/runner/work/molflux/molflux/.cache/nox/docs_build-3-11/lib/python3.11/site-packages/sklearn/model_selection/_split.py:91: UserWarning: The groups parameter is ignored by KFold
  warnings.warn(
<Axes: title={'center': 'k_fold'}, xlabel='Sample index', ylabel='CV iteration'>
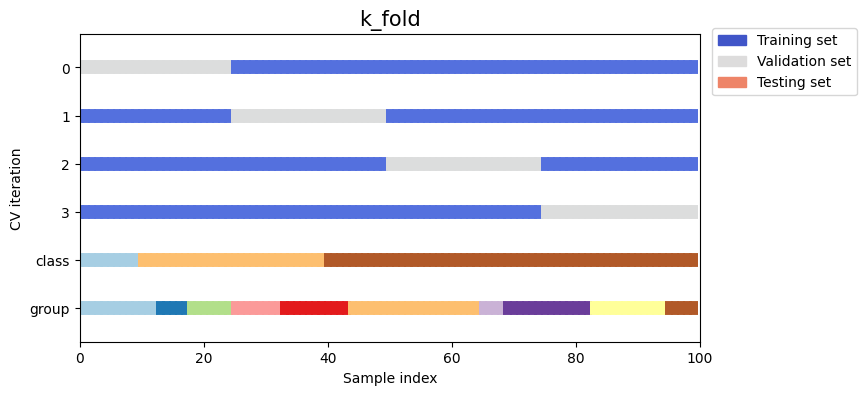
As you can see, by default the k_fold cross-validation iterator does not take either datapoint class or group into
consideration. We can change this by using either:
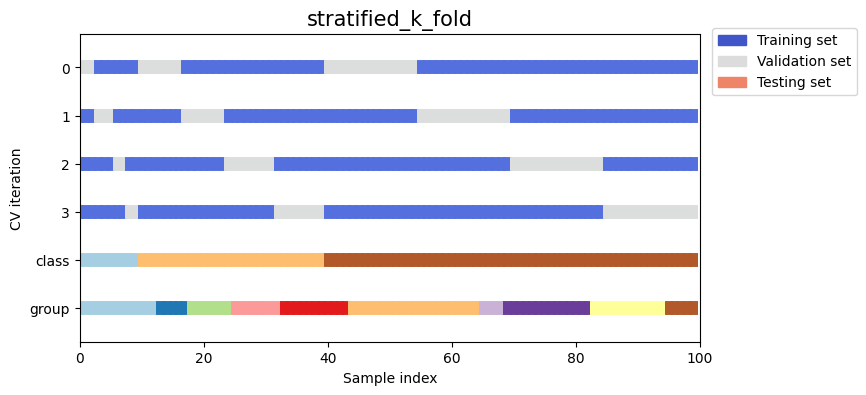
stratified_k_foldto preserve the percentage of samples for each class.group_k_foldto ensure that the same group will not appear in two different folds.
Show code cell source
strategies = ["stratified_k_fold", "group_k_fold"]

for name in strategies:
    fig, ax = plt.subplots(figsize=figsize)
    strategy = load_splitting_strategy(name)
    plot_cv_indices(strategy, X, y, groups, ax, n_splits)
/home/runner/work/molflux/molflux/.cache/nox/docs_build-3-11/lib/python3.11/site-packages/sklearn/model_selection/_split.py:848: UserWarning: The groups parameter is ignored by StratifiedKFold
  warnings.warn(
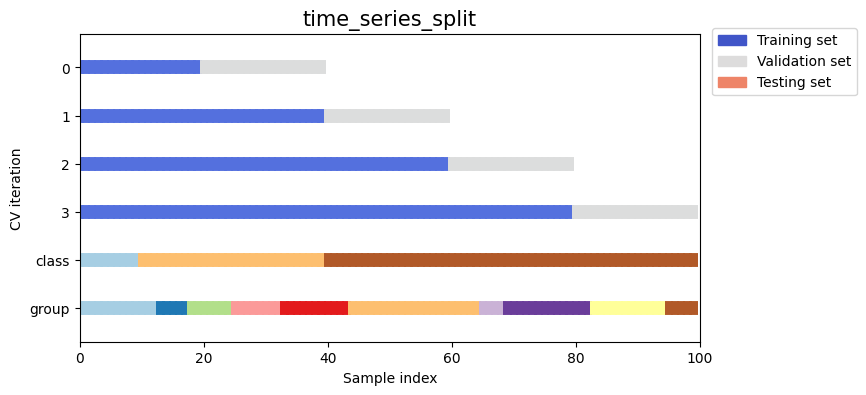
Next we’ll visualize this behavior for a number of splitting iterators.
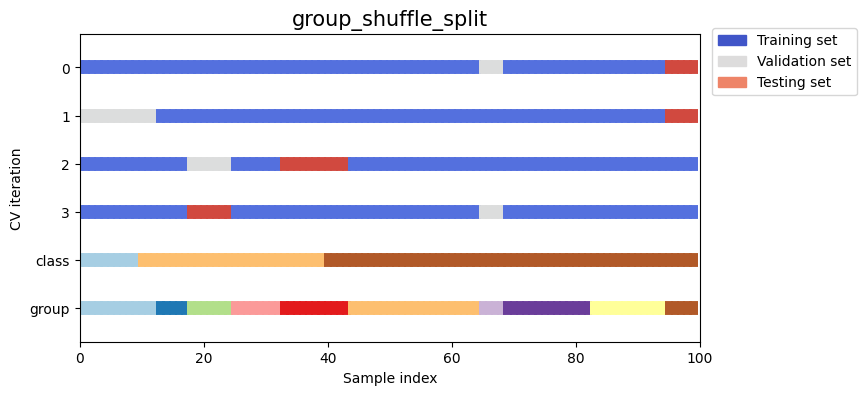
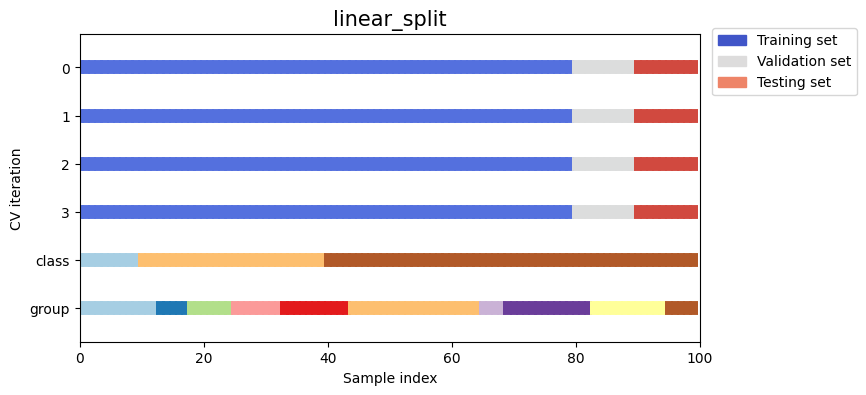
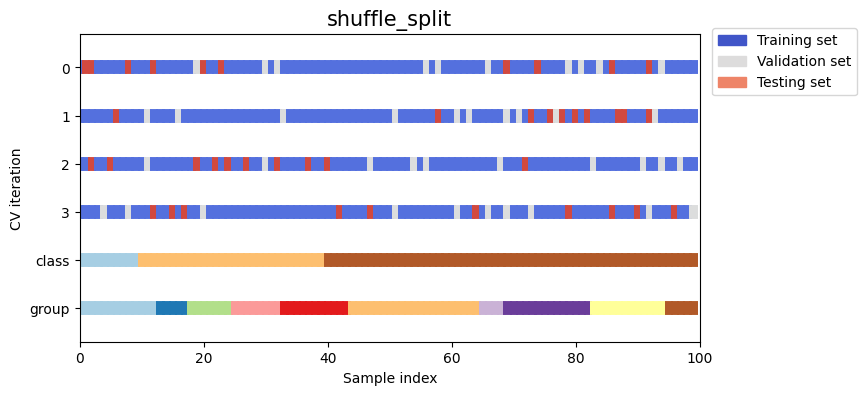
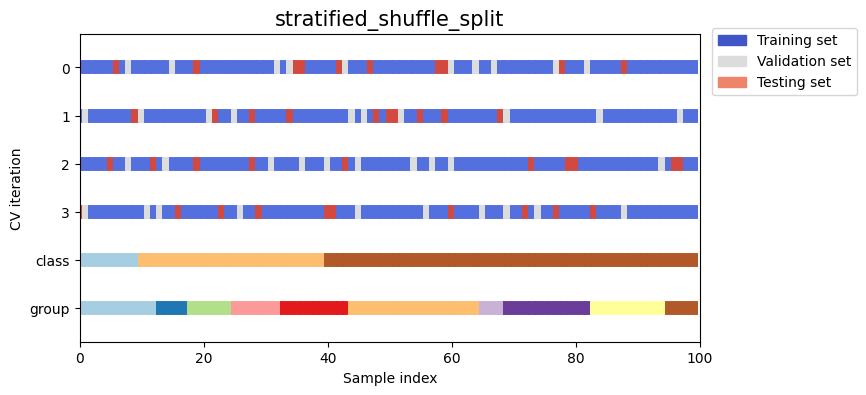
Visualize splitting behaviour for many splitting strategies#
Let’s visually compare the splitting and cross validation behavior for many of our splitting strategies. Below we will loop through several common strategies, visualizing the behavior of each.
Note how some use the group/class information while others do not:
Show code cell source
strategies = ["group_k_fold", "group_shuffle_split", "k_fold", "linear_split", "shuffle_split", "stratified_k_fold", "stratified_shuffle_split", "time_series_split"]

for name in strategies:
    fig, ax = plt.subplots(figsize=figsize)
    strategy = load_splitting_strategy(name)
    plot_cv_indices(strategy, X, y, groups, ax, n_splits)
/home/runner/work/molflux/molflux/.cache/nox/docs_build-3-11/lib/python3.11/site-packages/sklearn/model_selection/_split.py:91: UserWarning: The groups parameter is ignored by KFold
  warnings.warn(
/home/runner/work/molflux/molflux/.cache/nox/docs_build-3-11/lib/python3.11/site-packages/sklearn/model_selection/_split.py:848: UserWarning: The groups parameter is ignored by StratifiedKFold
  warnings.warn(
/home/runner/work/molflux/molflux/.cache/nox/docs_build-3-11/lib/python3.11/site-packages/sklearn/model_selection/_split.py:1213: UserWarning: The groups parameter is ignored by TimeSeriesSplit
  warnings.warn(