ESOL uncertainty#
In this tutorial we provide a simple example of training a random forest model on the ESOL dataset,
and adding an uncertainty estimator using Mapie on top. We require the rdkit
and mapie packages, so make sure to pip install 'molflux[rdkit,mapie]' to follow along!
Loading the ESOL dataset#
First, let’s load the ESOL dataset
from molflux.datasets import load_dataset

dataset = load_dataset("esol")

print(dataset)

dataset[0]
Repo card metadata block was not found. Setting CardData to empty.
Dataset({
    features: ['smiles', 'log_solubility'],
    num_rows: 1126
})
{'smiles': 'OCC3OC(OCC2OC(OC(C#N)c1ccccc1)C(O)C(O)C2O)C(O)C(O)C3O ',
 'log_solubility': -0.77}
The loaded dataset is an instance of a HuggingFace Dataset (for more info, see the docs).
You can see that there are two columns: smiles and log_solubility.
Featurising#
Now, we will featurise the dataset. For this, we will use the Morgan and MACCS fingerprints from rdkit and the
featurise_dataset function from molflux.datasets.
from molflux.datasets import featurise_dataset
from molflux.features import load_from_dicts as load_representations_from_dicts

featuriser = load_representations_from_dicts(
    [
        {"name": "morgan"},
        {"name": "maccs_rdkit"},
    ]
)

featurised_dataset = featurise_dataset(dataset, column="smiles", representations=featuriser)

print(featurised_dataset)
Dataset({
    features: ['smiles', 'log_solubility', 'smiles::morgan', 'smiles::maccs_rdkit'],
    num_rows: 1126
})
You can see that we now have two extra columns for each fingerprint we used.
Splitting#
Next, we need to split the dataset. For this, we use the simple shuffle_split (random split) with 70% training,
10% validation, and 20% test. To split the dataset, we use the split_dataset function from molflux.datasets.
from molflux.datasets import split_dataset
from molflux.splits import load_from_dict as load_split_from_dict

shuffle_strategy = load_split_from_dict(
    {
        "name": "shuffle_split",
        "presets": {
            "train_fraction": 0.7,
            "validation_fraction": 0.1,
            "test_fraction": 0.2,
        }
    }
)

split_featurised_dataset = next(split_dataset(featurised_dataset, shuffle_strategy))

print(split_featurised_dataset)
DatasetDict({
    train: Dataset({
        features: ['smiles', 'log_solubility', 'smiles::morgan', 'smiles::maccs_rdkit'],
        num_rows: 788
    })
    validation: Dataset({
        features: ['smiles', 'log_solubility', 'smiles::morgan', 'smiles::maccs_rdkit'],
        num_rows: 112
    })
    test: Dataset({
        features: ['smiles', 'log_solubility', 'smiles::morgan', 'smiles::maccs_rdkit'],
        num_rows: 226
    })
})
Training the model#
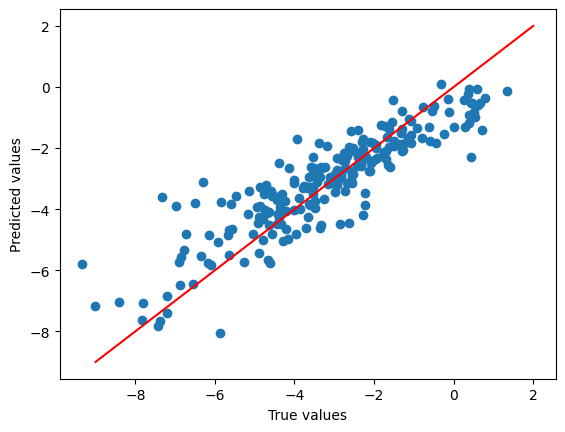
We can now turn to training the model! We choose the random_forest_regressor (which we access from the sklearn package).
To do so, we need to define the model config and the x_features and the y_features.
Once trained, we will get some predictions and compute some metrics!
import json

from molflux.modelzoo import load_from_dict as load_model_from_dict
from molflux.metrics import load_suite

import matplotlib.pyplot as plt

model = load_model_from_dict(
    {
        "name": "random_forest_regressor",
        "config": {
            "x_features": ['smiles::morgan', 'smiles::maccs_rdkit'],
            "y_features": ['log_solubility'],
        }
    }
)

model.train(split_featurised_dataset["train"])

preds = model.predict(split_featurised_dataset["test"])

regression_suite = load_suite("regression")

scores = regression_suite.compute(
    references=split_featurised_dataset["test"]["log_solubility"],
    predictions=preds["random_forest_regressor::log_solubility"],
)

print(json.dumps({k: round(v, 2) for k, v in scores.items()}, indent=4))

plt.scatter(
    split_featurised_dataset["test"]["log_solubility"],
    preds["random_forest_regressor::log_solubility"],
)
plt.plot([-9, 2], [-9, 2], c='r')
plt.xlabel("True values")
plt.ylabel("Predicted values")
plt.show()
{
    "explained_variance": 0.78,
    "max_error": 3.72,
    "mean_absolute_error": 0.75,
    "mean_squared_error": 0.98,
    "root_mean_squared_error": 0.99,
    "median_absolute_error": 0.57,
    "r2": 0.77,
    "spearman::correlation": 0.9,
    "spearman::p_value": 0.0,
    "pearson::correlation": 0.89,
    "pearson::p_value": 0.0
}

Adding a Mapie uncertainty estimator on top#
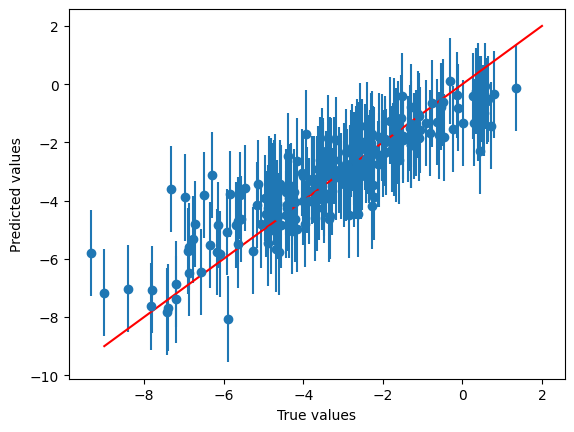
Once the random forest model is trained, we can build a Mapie estimator on top. For more information, check out the uncertainty for models section.
To build the Mapie model, you can first train a random forest model and then calibrate a Mapie model on the validation set as follows
mapie_model = load_model_from_dict(
    {
        "name": "mapie_regressor",
        "config": {
            "x_features": model.x_features,
            "y_features": model.y_features,
            "estimator": model,
            "cv": "prefit",
        }
    }
)

mapie_model.calibrate_uncertainty(split_featurised_dataset["validation"])

preds, intervals = mapie_model.predict_with_prediction_interval(
    split_featurised_dataset["test"],
    confidence=0.9,
)

xs = split_featurised_dataset["test"]["log_solubility"]
ys = preds["mapie_regressor[random_forest_regressor]::log_solubility"]
y_intervals = intervals["mapie_regressor[random_forest_regressor]::log_solubility::prediction_interval"]

yerrs = [
    [abs(y - y_in[0])  for y, y_in in zip(ys, y_intervals)],
    [abs(y - y_in[1])  for y, y_in in zip(ys, y_intervals)],
]

plt.errorbar(
    x=xs,
    y=ys,
    yerr=yerrs,
    fmt='o',
)
plt.plot([-9, 2], [-9, 2], c='r')
plt.xlabel("True values")
plt.ylabel("Predicted values")
plt.show()
/home/runner/work/molflux/molflux/.cache/nox/docs_build-3-11/lib/python3.11/site-packages/sklearn/utils/validation.py:1339: DataConversionWarning: A column-vector y was passed when a 1d array was expected. Please change the shape of y to (n_samples, ), for example using ravel().
  y = column_or_1d(y, warn=True)

And finally you get some error bars!